Unified Modelling Language (UML)
Systems modelling is a process of creating simplified representations or models of complex systems in order to understand their behaviour, analyse their dynamics, and make predictions or decisions based on those models. It involves the use of various mathematical and conceptual tools to describe and simulate the interactions and relationships among different components or elements within a system.
Systems modelling can be applied to a wide range of disciplines, including engineering, computer science, economics, ecology, and social sciences. It helps in studying and analysing systems that are too complex or costly to study directly, providing insights into system behaviour, potential improvements, and potential risks.
Here are some key aspects and techniques commonly used in systems modelling:
-
Conceptualization: Understanding and defining the boundaries, components, and interactions of the system being modelled. This involves identifying the relevant variables, parameters, and constraints.
-
Mathematical Modelling: Developing mathematical equations or algorithms to represent the behaviour of the system. These models can be deterministic (based on precise relationships) or probabilistic (incorporating uncertainty).
-
Simulation: Implementing the mathematical model in a computational environment to observe and analyse the behaviour of the system over time. Simulation allows for experimentation, testing different scenarios, and predicting system responses.
-
Optimization: Using the models to identify optimal or near-optimal solutions based on specific criteria. Optimization techniques help in finding the best set of inputs or actions to achieve desired outcomes.
-
Validation and Verification: Checking the accuracy and reliability of the models by comparing their predictions or results with real-world data or observations. This step helps ensure that the models adequately represent the actual system.
-
Sensitivity Analysis: Assessing the impact of changes in model inputs or parameters on the system outputs. Sensitivity analysis helps in understanding the relative importance of different factors and their influence on the overall system behaviour.
Overall, systems modelling provides a structured approach to studying complex systems, enabling analysis, prediction, and decision-making based on a simplified representation of reality. It helps in gaining insights into system behaviour, evaluating different strategies or interventions, and improving the understanding of complex phenomena.
Unified Modelling Language (UML) Types
Unified Modelling Language (UML) is a standardised visual modelling language used in software engineering to describe, specify, visualise, and document the structure and behaviour of a system. UML provides a variety of diagram types to represent different aspects of a system. Here are some commonly used UML diagram types:
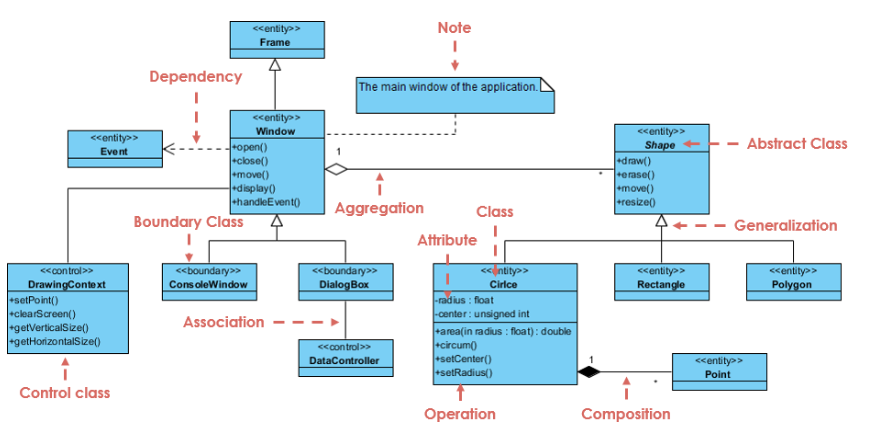
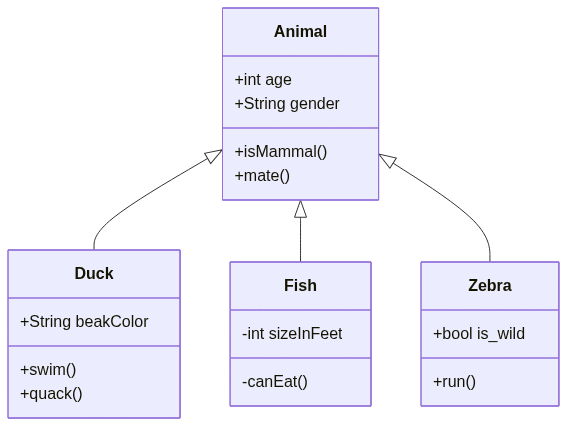
1. Class Diagram
Represents the static structure of a system by showing classes, attributes, operations, relationships, and their associations.
VISUAL PARADIGM, 2019. UML Class Diagram Tutorial Available from: https://www.visual-paradigm.com/guide/uml-unified-modeling-language/uml-class-diagram-tutorial/
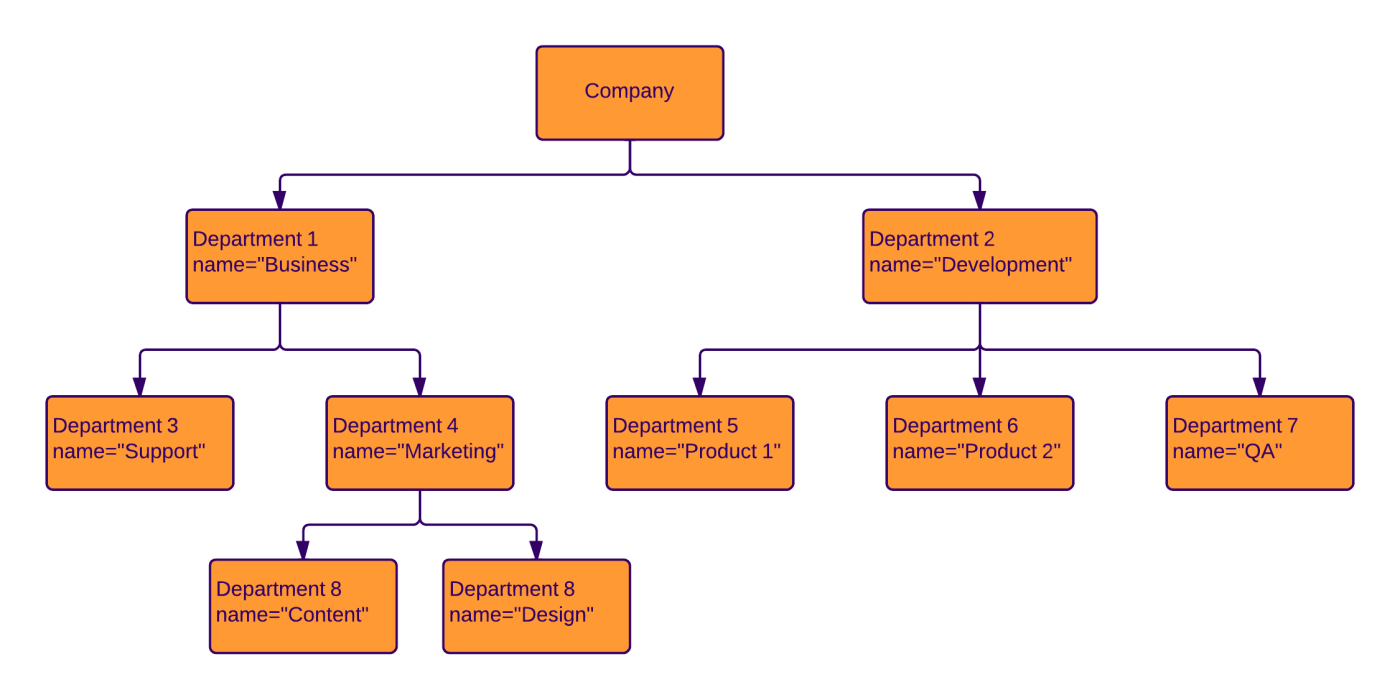
2. Object Diagram:
Depicts instances of classes and their relationships at a specific point in time. It shows the objects and their attributes and associations.
LUCIDCHART, 2023. Object Diagram Tutorial [viewed 30 May 2023]. Available from: https://www.lucidchart.com/pages/uml-object-diagram
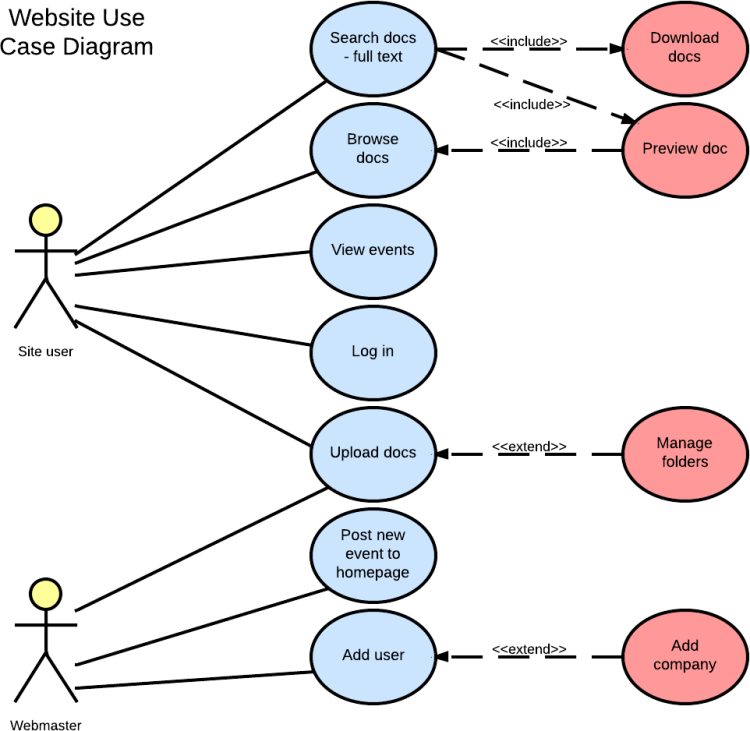
3. Use Case Diagram
Illustrates the functional requirements of a system by showing actors, use cases, and their relationships. It represents the interactions between the system and external entities.
| LUCIDCHART, 2019. UML Use Case Diagram Tutorial | Lucidchart [viewed 30 May 2023]. Available from: https://www.lucidchart.com/pages/uml-use-case-diagram |
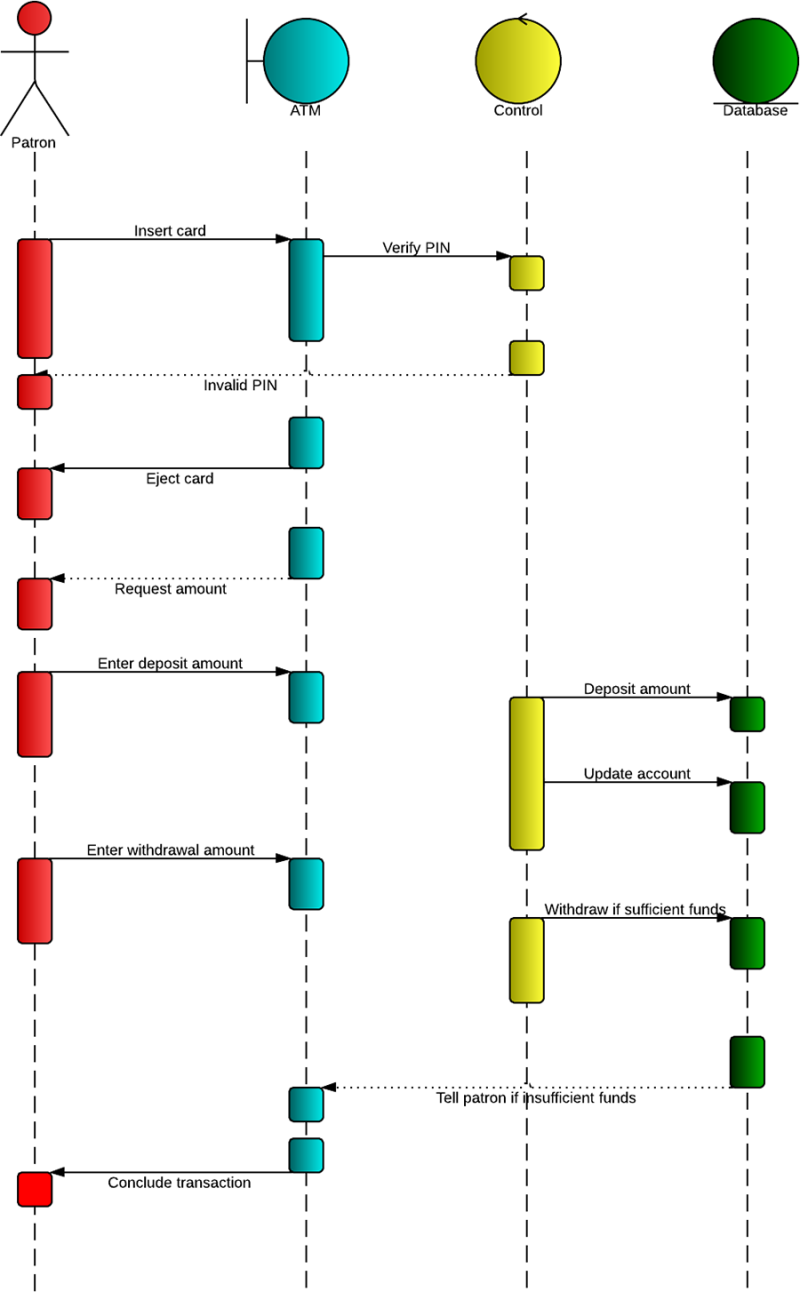
4. Sequence Diagram
Shows the interactions between objects in a sequential manner over time. It emphasizes the time ordering of messages exchanged between objects.
LUCIDCHART, 2019b. UML Sequence Diagram Tutorial [viewed 30 May 2023]. Available from: https://www.lucidchart.com/pages/uml-sequence-diagram
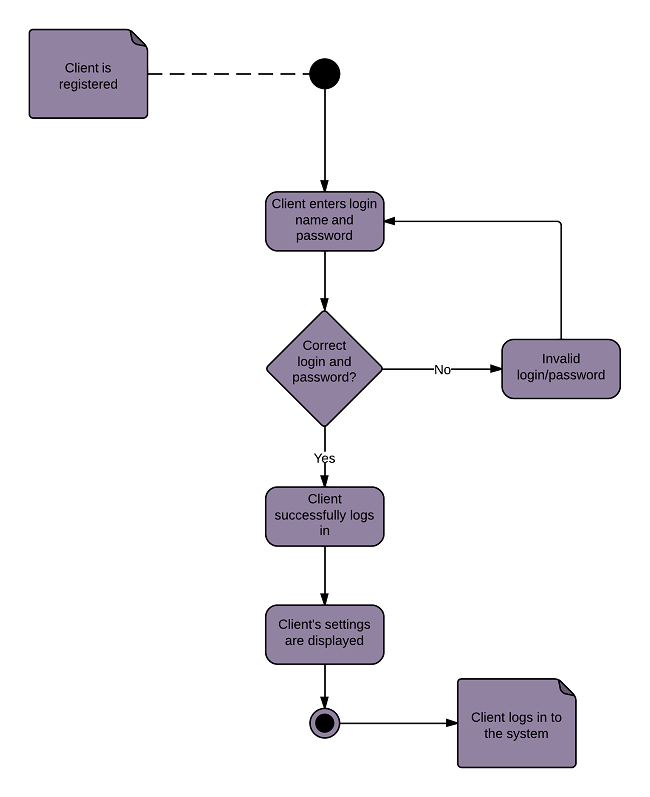
5. Activity Diagram
Represents the workflow or flow of activities in a system. It describes the dynamic behaviour of a system by showing the control flow, decisions, concurrency, and loops.
LUCIDCHART, 2023b. UML Activity Diagram Tutorial [viewed 30 May 2023]. Available from: https://www.lucidchart.com/pages/uml-activity-diagram
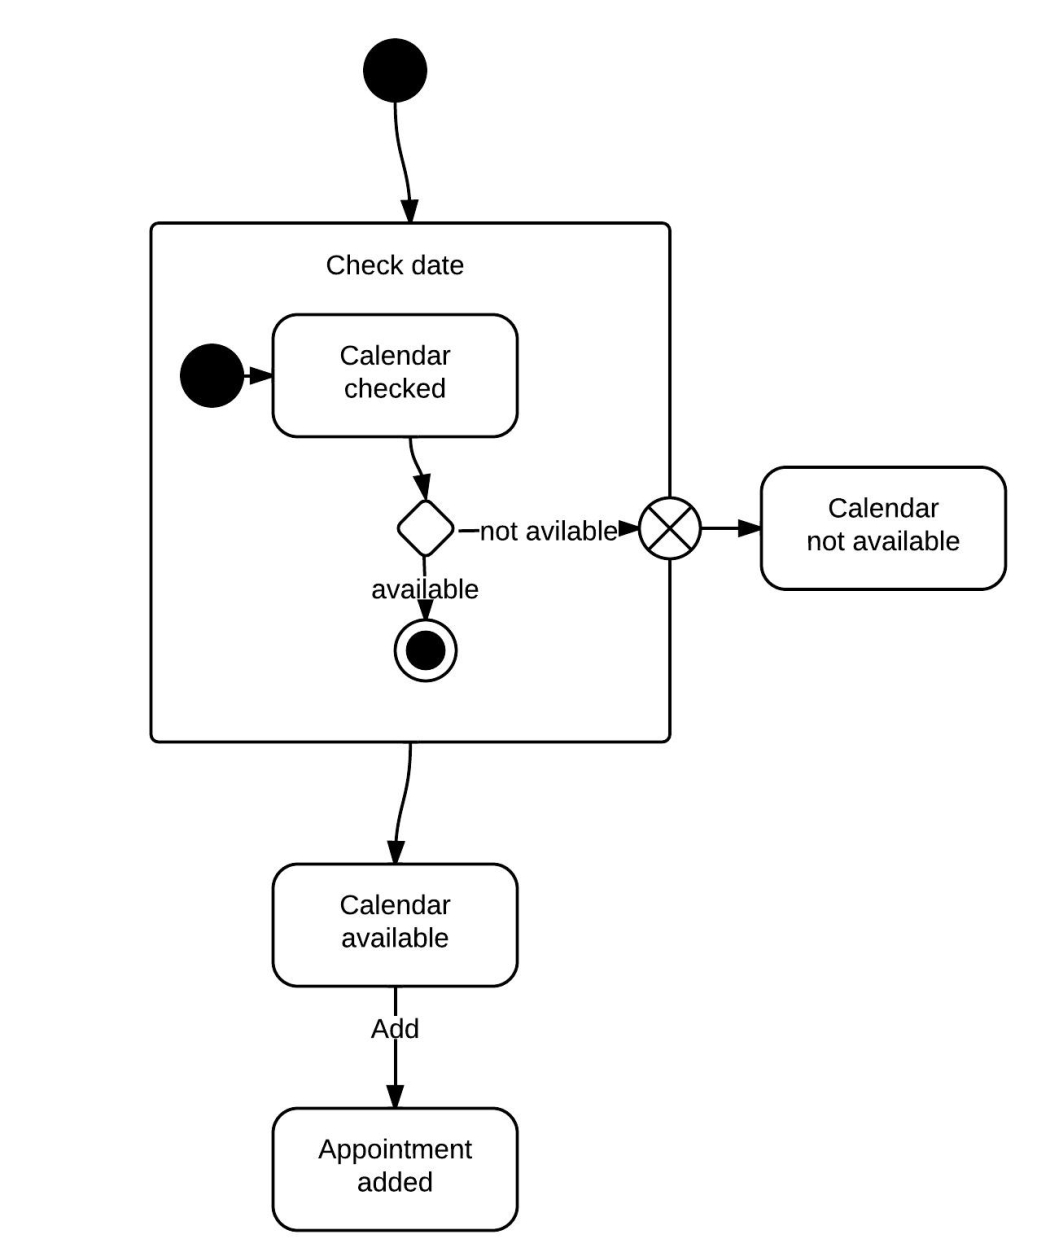
5. State Machine Diagram
Models the behaviour of an object or a system by representing the states, events, and transitions between states. It describes the possible sequences of states and their responses to events.
LUCIDCHART, 2023c. State Machine Diagram Tutorial [viewed 30 May 2023]. Available from: https://www.lucidchart.com/pages/uml-state-machine-diagram
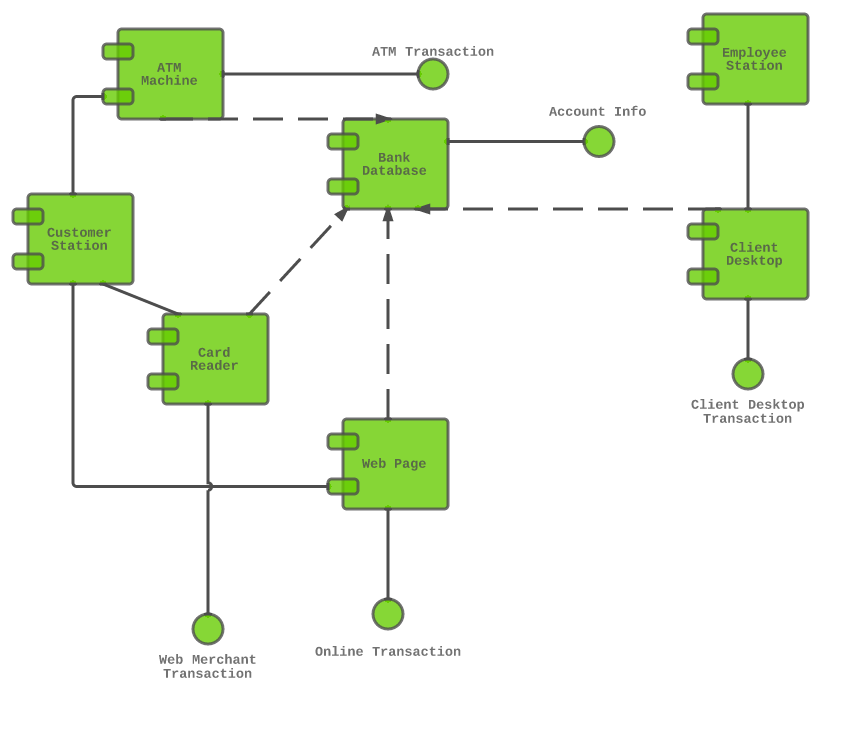
5. Component Diagram
Depicts the organization and dependencies of software components in a system. It shows the high-level structure of a system and the interfaces between components.
LUCIDCHART, 2019c. Component Diagram Tutorial [viewed 30 May 2023]. Available from: https://www.lucidchart.com/pages/uml-component-diagram
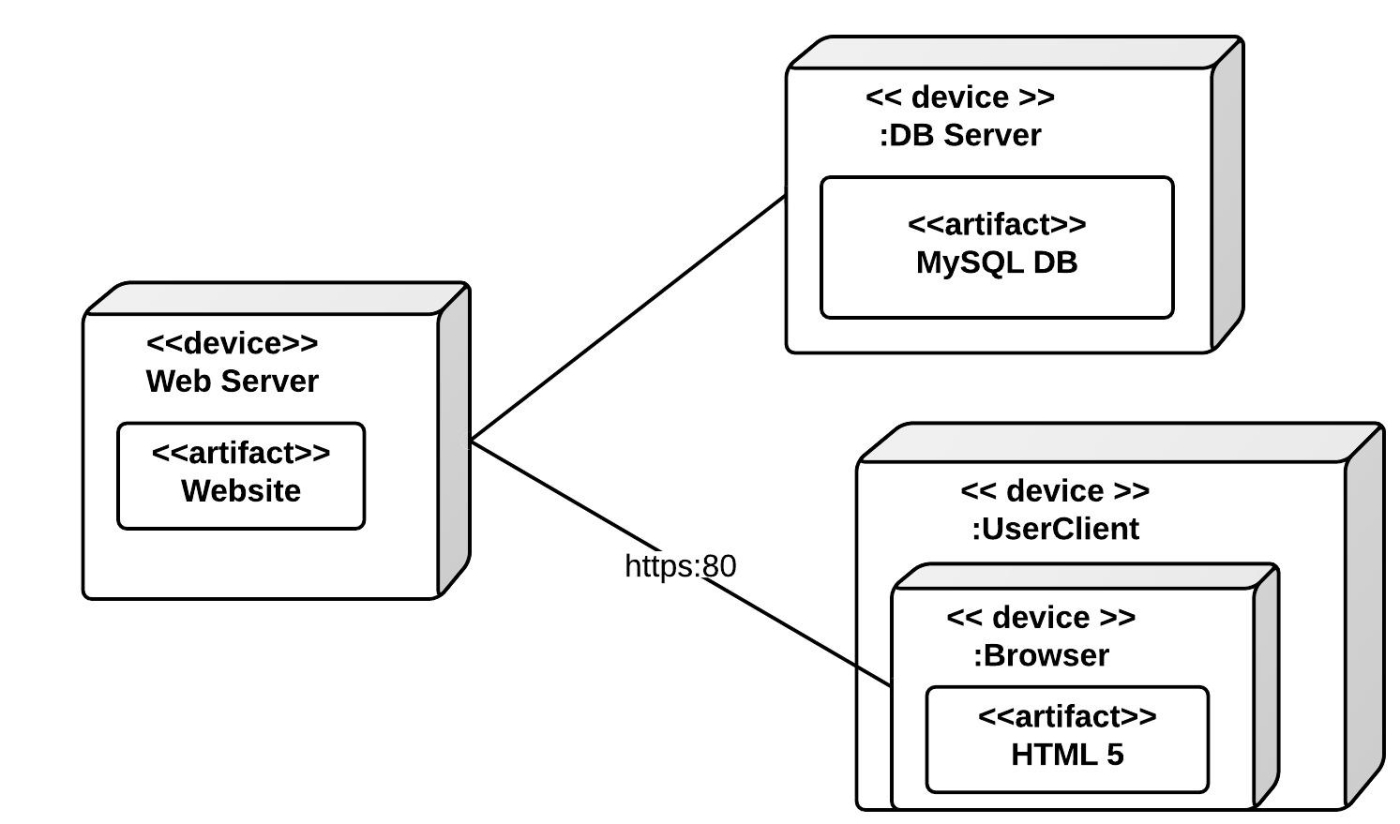
6. Deployment Diagram
Represents the physical deployment of software components on hardware nodes. It illustrates the hardware infrastructure and the distribution of components across nodes.
LUCIDCHART, 2023d. Deployment Diagram Tutorial [viewed 30 May 2023]. Available from: https://www.lucidchart.com/pages/uml-deployment-diagram
7. Package Diagram
Shows the organization and dependencies of packages or namespaces in a system. It provides a high-level view of the modular structure of a system.
LUCIDCHART, 2023e. Package Diagram Tutorial [viewed 30 May 2023]. Available from: https://www.lucidchart.com/pages/uml-package-diagram

8. Communication Diagram
Like a sequence diagram, it focuses on the interactions between objects but emphasizes the relationships between objects rather than the time ordering of messages.
LUCIDCHART, 2023f. Communication Diagram Tutorial [viewed 30 May 2023]. Available from: https://www.lucidchart.com/pages/uml-communication-diagram

9. Composite Structure Diagram
Describes the internal structure and collaborations of a class or component. It shows the structure and relationships between parts, ports, connectors, and other internal elements.
LUCIDCHART, 2023g. Composite Structure Diagram Tutorial [viewed 30 May 2023]. Available from: https://www.lucidchart.com/pages/uml-composite-structure-diagram

FreeCodeCamp UML Diagrams Full Course (Unified Modelling Language) Course
Learn about how to use UML diagrams to visualise the design of databases or systems. You will learn the most widely used Unified Modelling Language diagrams, their basic notation, and applications.
Tools and Platforms
There are a number of diagram software packages and platforms, ideally you need to pick one you are comfortable using or fits in with your organisation. Ideally picking one that can create diagrams by scripting which will help the process be less awkward and time consuming.
You can also get Live Editor platforms such as Mermaid and use AI to help you scaffold the basic structure using prompts in ChatGTP plus plugins for editors such as VS Code.
Mermaid

JavaScript based diagramming and charting tool that renders Markdown-inspired text definitions to create and modify diagrams dynamically.
Tasks
Try these prompts in ChatGTP:
Example Prompts:
Prompt: Create Mermaid code for Restaurant management system flow diagram.
Prompt: Create Mermaid code for Restaurant management system class diagram.
Play around with the flowing - more info can be found in Mermaid Docs
- online shopping system.
- social media platform.
- banking system.
- car rental management system.
- hotel reservation system.
- ticket booking system for an amusement park.
- music streaming application.
- e-learning platform.
- customer relationship management (CRM) system.how
- Restaurant management system flow diagram.
Remember, these prompts serve as starting points to generate UML diagrams. You can further customise the prompts based on specific requirements, functionalities, or additional features to make them more tailored to your learning objectives - such as Design a UML flow diagram for a restaurant management system and now create Mermaid code for this which then can be copied and pasted into Mermaid or Draw.io